What we’ve learned from Brightcove Global Video Index 2019
Brightcove’s Global Video Index seeks to uncover the ever evolving video industry trends through data driven insights. These trends, give an overview on the current video industry status and give us an idea on what to expect in the future.
Published only a few weeks ago, we summarize for you the key takeaways. The complete report can be downloaded here.
What we’ve learned from Brightcove Global Video Index 2019
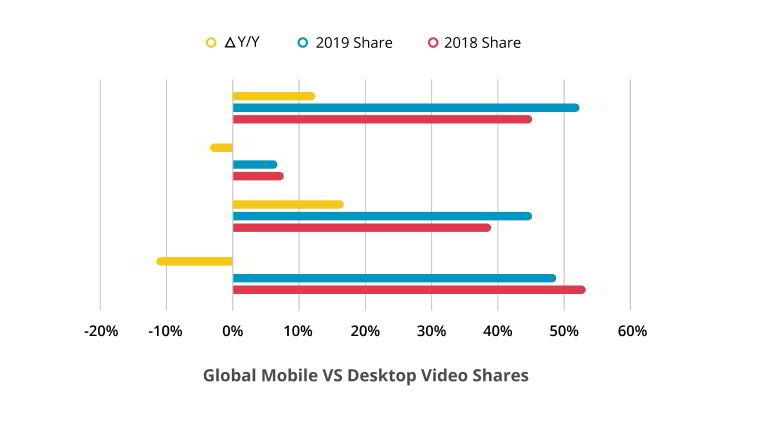
For over a decade, online video was primarily consumed on computers (desktops and laptops). Video views on tablets and smartphones globally made up 53% of video views, compared to 47% for computers on Brightcove’s infrastructure. While tablet viewers once were the rising stars of video consumption, smartphones with ever increasing high-quality screens, even on less expensive devices, are driving this growth.

Worldwide mobile traffic nearly doubled during 2018, and overall plays increased with 24%. Mobile phone views increased from 38.5% to 45.5%. Tablet views stayed relatively flat with a slight increase from 7.5% to 7.9%. Desktop views however fell with 12% to 47.2% from 53.6% Y/Y. In fact, mobile video traffic is forecast to increase at a CAGR (Compound Annual Growth Rate) of 34% through 2024.
The “Rise of Mobile” has been a solid one, initially driven by Millenials and younger consumers who turned to mobile devices as their primary screen. But, older demographics have increasingly adopted these habits and are becoming mobile first too. This has been confirmed by several researches. For instance, a 2019 study from Pew Research Center found that 37% of Americans say they go online primarily using a smartphone.
Key drivers of mobile video growth
What are the drivers for the increase in mobile video viewing?
The increasing availability of premium content over the top to mobile devices, and consumers’ willingness to watch it on a small screen, is key. Additional services, like Disney+, Apple+, YouTube Red, make even more content available.
Smartphone penetration is key. Already largely adopted by the North America’s and Western Europe, smartphone penetration stands at 104% and 122% respectively. Central and Eastern Europ’s penetration is a whopping 121%. China stands at 114%. And even emerging markets are seeing huge penetration with APAC (excluding China & India) at 114%, the Middle East is at 112%. LATAM 102%, India 85% and Africa 81%. It makes sense more users come online todat now that new, less-expensive, Android phones flood the market and the cost of mobile data drops.
The real new growth comes from emerging markets which saw double-digit growth in mobile phone video share. Ranked from high to low (Y/Y) the regional results are :
- Middle East/Africa : 57% ip from 40% (+43% Y/Y)
- Japan/Korea: 58%, up from 46% (+26% Y/Y)
- Europe: 36%, up from 29% (+24% Y/Y)
- Latin America: 33%, up from 26% (+27% Y/Y)
- Australia/New Zeeland: 28%, up from 24% (+17% Y/Y)
- APAC: 84%, up from 76% (+11% Y/Y)
- The Americas: 23%, down from 29% (-21% Y/Y)
Combined, tablet, mobile phones and mobile video took market share away from desktop in every market but the Americas.
Mobile is expected to grow even further. The next few years we will see a major expansion of wireless networks as 5G technology will deploy globally. Furthermore, mobile devices are, especially in emerging countries, often the single screen consumers own.
As such, it is crucial that OTT providers look to the delivery of video to mobile devices as a key pillar of their digital strategy. The user experience should be as clean as the one delivered to connected TVs and computers including ways to easily find the content or recommend the content directly to the viewer, which will help to keep them engaged.
Android is winning the battle for OS Dominance
iOS and Android have dominated the video market for years. iOS has been the dominant player in the early days with the iPhone and iPad defining how a real mobile device should work.
But the times have changed. The share of videos played on Android phones and tablets topped 64% in Q2 2019, up from 56% a year ago, where iOS saw its share slip to 36% from 44%.
Attention span, or the average minutes spent watching video on iPhones and Android phones increased over the past year. iPhones saw a substantial jump of 20% to 22.3 minutes watched where Android phones ros 6% to 16.8 minutes. On iPads and Android tablets average viewing time is relatively stable at 23.8 minutes and 21 minutes.
Regionally Android leads iOS 4-3 with The America, Australia/New Zealand and Japan/Korea being iOS dominant regions and Europe, APAC, LATAM, Middle East/Africa primarily using Android devices
Although Android is winning the battle, the days of being able to roll out an app for a single OS and believe that you had the market covered are gone. Even in iOS strongholds like Australia, New Zeeland, the Americas, Japan and Korea, the increased reliability, ease of use, and lower cost of Android devices are showing its impact. Although iPads and iPhones remain major players in the video market, they do not longer offer significantly superior devices compared to Android. Video providers must have an option for Android users or risk losing customers, particularly in emerging markets.
Engagement Patterns by Device
The screen at hand is the screen used to watch a video. Whether its on a commuter bus or on a holiday flight, we’ll watch that latest episode of Game of Thrones wherever we are and whenever we want. Offline playback, more reliable Wi-Fi, bigger data bundles and content owners’ willingness to go wherever their customers are has pushed an increasing amount of content onto the smallest screen.
As a reminder, video content is typically grouped into:
- Short-form video (0-5 minutes long)
- Medium-form video (6-20 minutes long)
- Long-form video (21-40 minutes long)
- Ultra-long-form video (41+ minutes)
More and more, people are watching long-form content on mobile devices where this was, as you’d expected long time dominated by connected TVs. The opposite is also through, more and more short-form video’s are being consumed on connected TVs.
Data shows that the most important screen for video viewing is the one that’s most convenient, whether that convenience is based on proximity, cost, or the robustness of a network. The length of the content doesn’t bring people to different devices anymore and mobile devices are often the only option of consuming the content.
The trend toward mobile-centric video is continuing. Every screen presents opportunities regardless if you own 50.000 short video clips or 500 movies. Expecting your content will be watched on any one screen is a mistake, so make sure to offer the same experience on a six-inch screen as on a 60+ inch screen. Focus on any one screen and you’ll be passing up opportunities to grow your business.

